How to Implement Metal Production Line Automation: Complete ROI Framework 2026
Most automation projects in metal processing don’t fail because the equipment was wrong. They fail because the implementation was wrong. A slitting line with servo controls and real-time tension monitoring delivers its stated performance only when the electrical infrastructure can support it, the operators understand what the system is doing, and someone has defined what “success” looks like before the first coil runs.
This guide covers the implementation process from baseline analysis through stable production — and gives you a structured framework for calculating whether the ROI justifies the investment before you commit.
Before You Buy Anything: Establish Your Baseline
Automation ROI is calculated as the difference between your current operating costs and your projected operating costs after implementation. That calculation is only as reliable as your baseline data. Facilities that skip this step routinely discover that their “expected” yield improvement was overstated, their labor savings were already partially achieved, or their biggest cost driver wasn’t the one they were targeting.
The four baseline numbers you need before any automation conversation:
- Current material yield (%): Total acceptable output weight ÷ total input coil weight × 100. Track this for 30–60 days across your material mix to capture normal operational variation — not your best week.
- Current scrap rate by category: Distinguish between edge trim (structural, unavoidable), setup scrap (first and last sections of coil), and defect scrap (dimensional, surface, or edge quality). Each category responds differently to automation.
- Current changeover time per SKU transition: Measured from last acceptable piece of previous job to first acceptable piece of next job. Most facilities underestimate this by 30–40% when relying on operator estimates rather than actual timing.
- Downtime hours per month, categorized: Planned maintenance, unplanned mechanical failure, quality holds, material jams, and changeover. Automation reduces some categories while leaving others unchanged — knowing which is which determines your realistic upside.
Without these numbers, any ROI projection is a guess.
Phase 1: Define Specific, Measurable Improvement Targets
Vague targets produce vague results. The facilities that successfully implement automation set targets in the same units they measure baseline performance.
Examples of useful targets:
- Reduce edge trim scrap from 3.2% to under 1.8% of coil input weight
- Reduce changeover time from 47 minutes average to under 20 minutes
- Reduce unplanned downtime from 11 hours/month to under 4 hours/month
- Improve dimensional accuracy from ±0.6mm slit width to ±0.2mm or better
Examples of targets that predict disappointment:
- “Improve productivity”
- “Reduce waste”
- “Modernize operations”
- “Achieve Industry 4.0 compliance”
Each useful target connects directly to a specific automation feature — servo-driven blade positioning for slit width accuracy, recipe management systems for changeover time, predictive maintenance sensors for unplanned downtime. This connection lets you evaluate whether a given system’s technical specification actually addresses your problem.
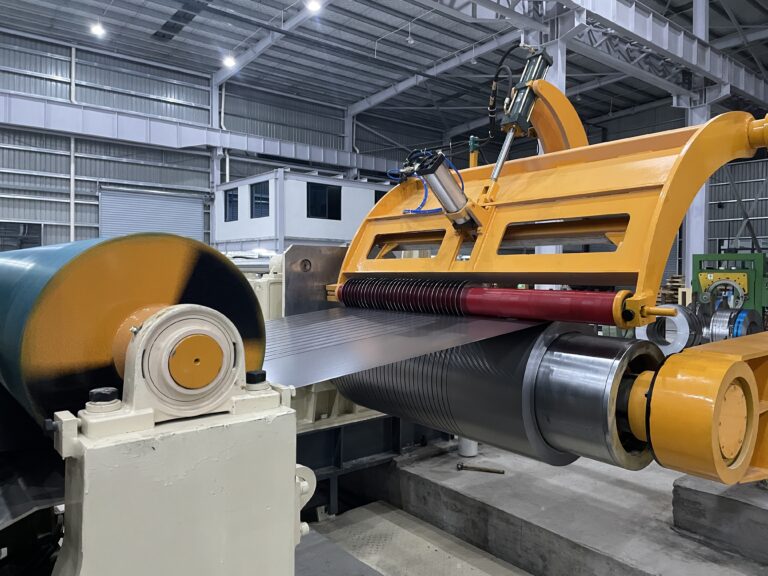
For reference: MaxDoMachine’s MD-2200 documents slit width tolerance of ±0.1mm at speeds up to 200 m/min. If your current tolerance is ±0.6mm and your downstream customer requires ±0.15mm, that is a concrete, verifiable target this system can address. Source: MaxDoMachine product documentation
Phase 2: Infrastructure Assessment — The Step That Kills Timelines
Site preparation failures account for a disproportionate share of implementation delays and cost overruns. The following checklist should be completed before equipment is ordered, not after it ships.
Infraestructura eléctrica
- [ ] Confirm available electrical capacity at installation point (kW and amperage), not just at the facility meter
- [ ] Verify voltage stability — servo drive systems are more sensitive to voltage fluctuation than hydraulic systems
- [ ] Confirm whether regenerative drives are planned; these require grid compatibility assessment
- [ ] Check that panel room space and cable routing paths exist for new control cabinets
Reference power requirements by MD Series model (from official MaxDoMachine specification sheets):
| Modelo | Potencia total | Aplicación |
|---|---|---|
| MD-850MM | ~138.5kW | Light gauge, narrow strip, entry-level automation |
| MD-1350MM | ~318.5kW | Mid-range coil processing, service center standard |
| MD-1650MM | ~422.5kW | Wide coil processing, appliance and construction |
| MD-2200MM | ~422.5kW | Wide-format automotive and appliance, up to 2,150mm |
Floor and Structural
- [ ] Floor loading calculation for full equipment weight plus coil (coils up to 35 tons)
- [ ] Anchor bolt positions and foundation requirements from supplier
- [ ] Overhead crane clearance for coil loading
- [ ] Minimum ceiling height for uncoiler and upender operations
Utilities
- [ ] Compressed air capacity and pressure — sized for peak demand during simultaneous actuator operation, not average consumption
- [ ] Coolant or lubrication supply if required
- [ ] Drainage for any coolant systems
IT/OT Integration
- [ ] ERP or MES system compatibility: identify the integration protocol the new line will use to receive production orders and report output data
- [ ] Network infrastructure in the production area: Ethernet drops, Wi-Fi coverage, firewall rules for SCADA access
- [ ] Data historian requirements: where production data will be stored and for how long
Infrastructure gaps discovered during installation add cost and delay that was not in the project budget. A full infrastructure assessment before purchase is not overhead — it is risk management.
Phase 3: Procurement and Supplier Qualification
Total Cost of Ownership, Not Purchase Price
Equipment purchase price represents approximately 60–75% of total implementation cost. The remaining cost categories are frequently underweighted in initial budgeting.
Typical implementation cost structure (based on industry-published implementation data and MaxDoMachine guidance):
| Cost Category | Typical Range as % of Equipment Cost | Notes |
|---|---|---|
| Equipment purchase | — | Baseline |
| Site preparation and facility modifications | 15–25% | Electrical upgrades, foundation, HVAC if required |
| Instalación y puesta en marcha | 10–20% | Varies with line complexity and integration scope |
| Training and startup | 5–10% | Operator, maintenance, management-level training |
| IT/OT integration | 5–15% | ERP/MES connection, data historian, network |
| Contingency | 10% | Infrastructure surprises, commissioning extensions |
For MaxDoMachine MD Series lines, published equipment cost ranges from approximately $400,000 for compact MD-850 systems to $1,500,000+ for fully automated MD-2200 configurations with advanced material handling. Source: MaxDoMachine
Operating cost categories over a 10-year lifecycle to budget:
- Wear parts: slitting blades, separator discs, tension roll surfaces
- Planned maintenance labor (in-house or contracted)
- Energy (calculate from nameplate power × estimated utilization hours)
- Software licenses or support contracts if applicable
- Spare parts inventory carrying cost
Modern servo-driven systems typically consume 20–30% less energy than hydraulic predecessors of equivalent capacity, primarily because servo systems draw power only during active movement rather than maintaining continuous hydraulic pressure. Source: MaxDoMachine documentation
Supplier Reference Calls: What to Actually Ask
Do not rely on supplier-mediated reference conversations. Request direct contact information and speak with reference customers without the supplier present. The questions that generate useful information:
- “What did the installation timeline actually look like versus what was projected?”
- “What infrastructure requirements were discovered after the equipment arrived?”
- “How long did it take to reach stable production at your target throughput?”
- “What does parts availability and technical support actually look like in your region?”
- “If you were buying again, what would you do differently?”
Phase 4: Installation and Commissioning Timeline
Deployment of automated metal slitting and CTL lines typically spans 16 to 24 weeks from equipment delivery to operator sign-off, depending on system complexity and facility integration scope. Source: MaxDoMachine documentation
This timeline covers not just mechanical installation but precision calibration, control system integration, I/O testing, and process parameter development. Breaking it down:
Week 1–4: Mechanical Installation
- Equipment positioning, anchoring, alignment
- Hydraulic and pneumatic system connection
- Electrical interconnection between machine sections
- Safety system hardware installation
Week 5–8: Control System Integration
- PLC programming verification and I/O testing
- HMI configuration and operator screen setup
- ERP/MES integration testing
- Safety system functional testing and certification
Week 9–12: Process Commissioning
- First material runs at reduced speed
- Parameter development for initial material grades
- Dimensional calibration and measurement system verification
- Operator training — initial sessions
Week 13–16: Production Qualification
- Full-speed runs with production material
- Quality acceptance testing against specification
- Recipe development for primary product mix
- Operator training — advanced topics, changeover procedures, fault response
Week 17–24 (if complex integration): Optimization and Handover
- Performance data collection and analysis
- Fine-tuning of process parameters
- Predictive maintenance system baseline establishment
- Final documentation and operator sign-off
Full operational efficiency — defined as consistent throughput at target yield on your full product mix — is typically reached 6 to 12 months post-installation. Source: MaxDoMachine documentation Production targets during ramp-up should increase incrementally, not immediately jump to full capacity.
Phase 5: Ramp-Up Management
The period between mechanical commissioning and stable full production is where the ROI either develops or erodes. The facilities that reach stable production fastest share a common approach:
Set conservative production targets for the first 90 days. The goal is process stability, not maximum throughput. An automated line running at 70% capacity with consistent quality creates the data foundation for optimization. An automated line being pushed to 100% immediately generates exceptions, operator workarounds, and a growing body of undocumented adjustments.
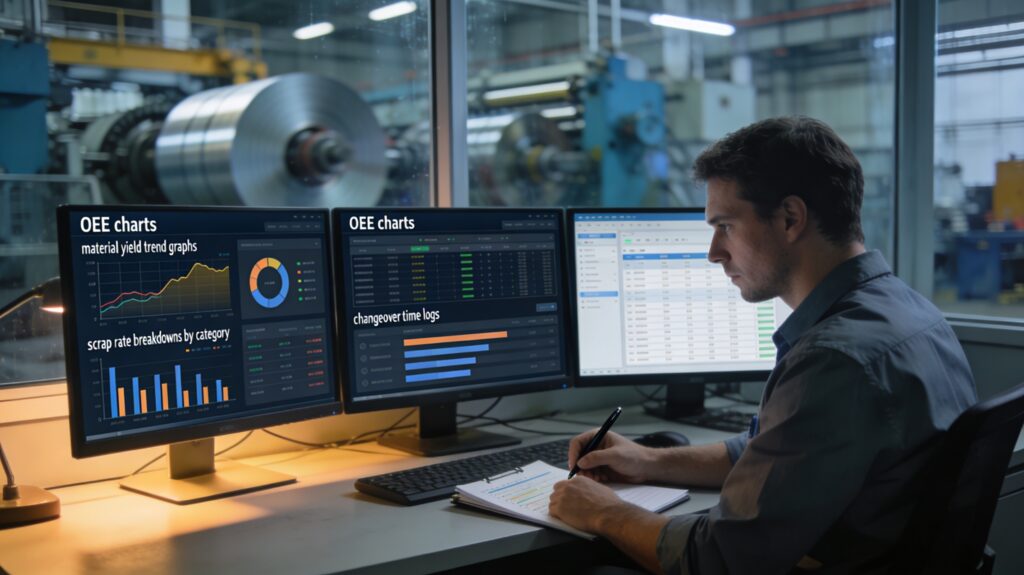
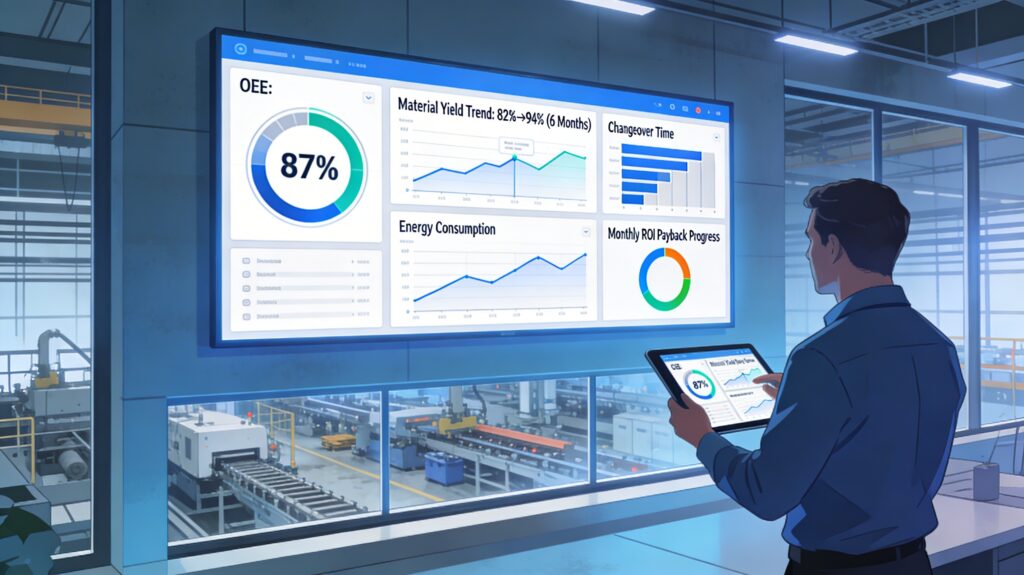
Track the right KPIs from day one:
- OEE (Overall Equipment Effectiveness): Target >85% for mature automated systems; expect 60–70% during ramp-up Source: MaxDoMachine documentation
- First-pass quality rate: Target >98% for dimensional specifications at steady state Source: MaxDoMachine documentation
- Changeover time per transition: Track every changeover; the trend line tells you whether operators are internalizing the procedure or working around it
- Unplanned downtime events: Categorize every event — control system, mechanical, material, operator — to identify where to focus maintenance and training attention
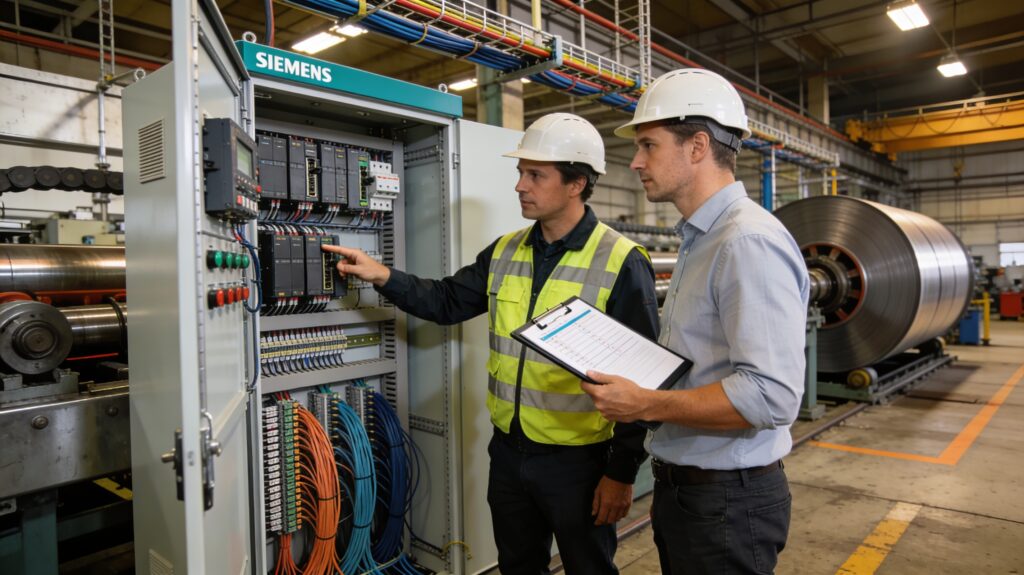
Invest in maintenance training, not just operator training. The operators who run the machine determine throughput. The maintenance team that keeps it running determine uptime. Both need training that goes beyond reading the manual: maintenance personnel should understand the predictive maintenance logic, know how to interpret sensor trend data, and be able to identify early failure indicators before they cause downtime.
Marco de cálculo del ROI
The Core Formula
Payback (months) = Total Implementation Investment ÷ Monthly Net Benefit
Monthly Net Benefit = (Material Savings + Labor Savings + Quality Savings + Energy Savings) − Ongoing Operating Cost Increase
Source: Oxmaint, ROI of Manufacturing Plant Automation 2026
Building Your Calculation: A Step-by-Step Approach
Step 1: Quantify material savings
- Annual processing volume (tons) × material cost per ton × (new yield% − current yield%) = annual material savings
- Apply separately to each material grade if your cost per ton varies significantly
Step 2: Quantify labor impact
- Be specific: which roles change, by how much, and how? Operator headcount reduction, shift reduction, elimination of secondary inspection or rework steps
- Include overtime costs that automation eliminates
Step 3: Quantify quality and rework savings
- Current annual cost of customer returns, rework, and downgraded material
- Apply your expected defect rate improvement (based on supplier-documented performance data)
Step 4: Quantify energy impact
- Current energy cost for the target line × 20–30% reduction factor for servo vs. hydraulic systems
- Use actual energy cost per kWh, not national averages
Step 5: Calculate total annual benefit
- Sum all savings categories above
Step 6: Subtract ongoing cost increases
- Any new maintenance contracts, software licenses, or consumable cost increases
Step 7: Divide total investment by net monthly benefit
- This is your payback period in months
Sensitivity Check
After calculating your base case, run the same calculation with:
- Yield improvement at 50% of projected (conservative scenario)
- Material prices 15% lower (downside on savings value)
- Implementation costs 20% higher (infrastructure surprises)
If the payback period is still acceptable in all three scenarios, the project has robust economics. If it only works in the optimistic case, the risk profile is higher.
Checklist: Implementation Readiness
Before committing to purchase, confirm:
- [ ] 30–60 day baseline data collected for yield, scrap, changeover, and downtime
- [ ] Specific, measurable improvement targets defined and agreed internally
- [ ] Infrastructure assessment completed (electrical, floor, utilities, IT/OT)
- [ ] Total cost of ownership calculated including all non-equipment costs
- [ ] Reference customers contacted and interviewed without supplier present
- [ ] ROI calculated in base case and two downside scenarios
- [ ] Phased implementation plan agreed with supplier (start date, milestone dates, sign-off criteria)
- [ ] Training plan confirmed: scope, timing, who delivers, what it covers
- [ ] Post-commissioning support scope confirmed in writing
Preguntas frecuentes
How much does a complete automated slitting or CTL line cost?
Based on published MaxDoMachine data, equipment-only costs range from approximately $400,000 for compact MD-850 configurations to $1,500,000+ for fully automated MD-2200 systems with advanced material handling. Total implementation cost including site preparation, installation, training, and integration adds a further 40–65% on top of equipment cost. Source: MaxDoMachine
What is a realistic payback period for metal processing automation?
Payback periods depend on material cost, volume, current yield losses, and labor structure. Based on published industry data, predictive maintenance and coil processing automation typically delivers payback in 4–18 months depending on implementation scope. [Source: Oxmaint 2026] The facilities at the short end of that range are those with high material costs, high current scrap rates, or significant changeover time losses.
Should we automate everything at once or phase it?
Phased implementation consistently outperforms comprehensive simultaneous automation. Starting with the highest-ROI element — typically dimensional accuracy and yield improvement — establishes stable process control and real performance data before adding complexity. It also allows the operations team to develop competence with automated systems before managing multiple simultaneous new technologies.
What’s the difference between OEE and uptime?
Uptime measures the percentage of scheduled time the equipment is running. OEE (Overall Equipment Effectiveness) multiplies availability × performance rate × quality rate — giving a single metric that captures downtime, speed losses, and quality defects simultaneously. A line can have 95% uptime but 70% OEE if it runs slowly or produces quality rejects during that uptime. Target OEE >85% for mature automated systems. Source: MaxDoMachine documentation
When should we involve operators in automation planning?
Before the equipment is ordered. Operators who understand why the automation is being implemented, what it will change in their daily work, and how their performance will be measured after implementation adopt new systems faster and work around them less. Late involvement is one of the most consistent predictors of slow ramp-up.
For slitting line and CTL line ROI modeling specific to your material mix and production volume, contact MaxDoMachine’s engineering team. Relevant guides: MD Series specifications and selection guide | Advanced slitting line yield optimization | 5 key advantages of CTL lines